HTML Viewer: Optimize Core Web Vitals & Boost Site Performance
How do I view HTML source code while optimizing website performance? Every developer and SEO specialist faces this dual challenge. Slow-loading websites destroy user experience and torpedo search rankings. Google's Core Web Vitals—LCP, FID, and CLS—measure critical aspects of page experience. In this guide, you'll discover how HTML Viewer helps you conquer these metrics while inspecting, editing, and perfecting your code. Start optimizing with our free toolkit today.
Understanding Core Web Vitals: The Foundation of Web Performance
What Are Largest Contentful Paint (LCP), First Input Delay (FID), and Cumulative Layout Shift (CLS)?
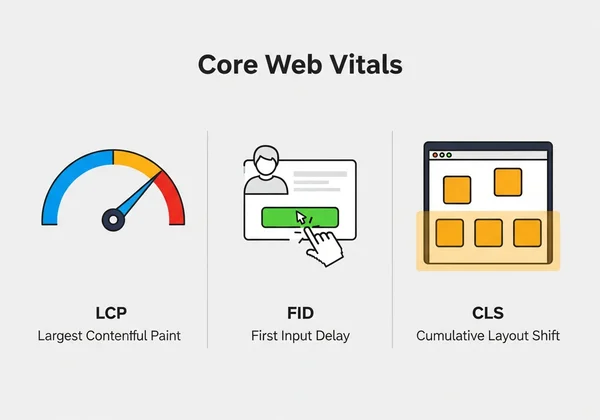
Core Web Vitals quantify real-world user experience based on three key metrics:
- Largest Contentful Paint (LCP) measures loading speed. It marks the point when the page's main content has likely loaded. Your target should be 2.5 seconds or less.
- First Input Delay (FID) tracks interactivity. It measures the time from when a user first interacts with a page to the time when the browser is actually able to respond. A good FID is 100 milliseconds or less.
- Cumulative Layout Shift (CLS) calculates visual stability. It quantifies how much unexpected layout shift users experience as the page loads. Aim for a CLS score of 0.1 or less.
Failing to meet these benchmarks can significantly impact your site's visibility and user retention.
Why Core Web Vitals Matter for Your SEO Rankings
Since Google's Page Experience update, Core Web Vitals have become a confirmed ranking factor. Sites that provide a superior user experience are rewarded with better search engine placement. Websites with "Good" scores across the board often see tangible benefits, including:
- Higher organic traffic due to improved rankings.
- Lower bounce rates as users are less likely to leave a fast, stable page.
- Increased conversion rates because a smooth experience builds trust.
Tools like Google Lighthouse are great for measuring scores, but fixing the underlying issues requires real-time HTML manipulation—exactly where HTML Viewer’s online editor shines.
How to Measure Your Current Core Web Vitals Score
- Navigate to Google's PageSpeed Insights tool.
- Enter your website's URL and run the analysis.
- Review the "Core Web Vitals" section to see your LCP, FID, and CLS scores for both mobile and desktop.
- For any pages that need improvement, use HTML Viewer’s URL import feature to instantly load the source code and begin debugging.
This combination of instant diagnosis and immediate editing capability streamlines the entire optimization process.
Using HTML Viewer's Minify Feature to Improve LCP Scores
How HTML Minification Reduces File Sizes and Loading Time
Minification is the process of removing all unnecessary characters from source code without changing its functionality. This includes:
- Whitespace (spaces, newlines, tabs)
- Code comments
- Redundant attributes and empty elements
A minified HTML file can be 25-40% smaller, leading to faster download times and a significantly improved LCP. HTML Viewer’s one-click minifier shrinks your code instantly and safely.

Step-by-Step Guide to Minifying HTML for Better LCP
- Open HTML Viewer in your browser.
- Paste your raw HTML code into the editor or import it directly using a URL.
- Click the Minify button. The optimized code will appear immediately.
- Copy the minified code and replace the original on your server.
- Retest your URL with PageSpeed Insights to see the LCP improvement.
Pro Tip: For maximum impact, combine HTML minification with GZIP compression on your server. This can lead to a total file size reduction of over 70%.
Case Study: From Lagging to Leading with HTML Optimization
A travel blog was struggling with poor mobile engagement. Their diagnostic scores were alarming: an LCP of 4.1s, an FID of 165ms, and a CLS of 0.21. After importing their homepage URL into HTML Viewer, they immediately saw bloated, unminified code.
The Fix:
- HTML Minification: Using the one-click minifier, they reduced the HTML document size by 35%.
- Code Cleanup: The real-time preview helped them identify and remove several deprecated scripts that were blocking the main thread.
- Layout Correction: By beautifying the code, they spotted a missing
widthattribute on their hero image, a primary cause of their high CLS.
The Results: Their LCP dropped to 2.4s (a 41% improvement), FID improved to 80ms, and CLS plummeted to a near-perfect 0.02. Within 60 days, their mobile organic traffic increased by 62% as they climbed the SERPs for their target keywords.
Preventing Layout Shifts with HTML Beautification
Understanding How Poor HTML Structure Causes Layout Shifts
Unexpected layout shifts (the cause of poor CLS scores) often happen when elements on the page move after they've already been rendered. Common culprits include:
- Images or iframes without
widthandheightdimensions. - Dynamically injected ads or banners that push content down.
- Web fonts that load late, causing a flash of unstyled or invisible text.
Poorly formatted or inconsistent HTML can make these issues harder to spot and debug.
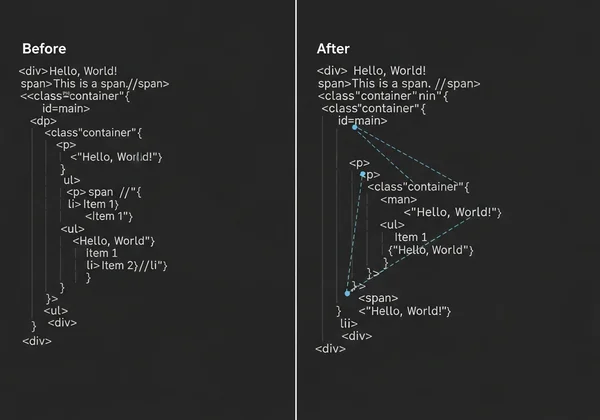
Using HTML Beautifier to Create Consistent Page Layouts
HTML Viewer’s Beautify tool is your first line of defense against structural chaos. It automatically cleans and formats your code by:
- Correcting indentation to reveal proper hierarchy.
- Ensuring proper nesting of elements.
- Making structural errors like unclosed tags easier to identify.
A clean, readable structure is fundamental for building a visually stable page. Clean your HTML structure here before deploying any changes.
Combining CSS Optimization with HTML Structure for Better CLS
To achieve an excellent CLS score, supplement your clean HTML with smart CSS practices:
- Always specify
widthandheightattributes for images and video elements. - Use the CSS
aspect-ratioproperty to reserve space for responsive elements. - Prefer CSS
transformfor animations over properties that trigger layout changes, liketoporleft.
You can test how these CSS changes interact with your markup by using HTML Viewer’s real-time preview pane after each edit.
Real-Time Preview: Catching Performance Issues Before They Go Live
How Real-Time Preview Identifies Slow-Loading Elements
The preview pane in HTML Viewer acts as a mini-browser, rendering your code as you type. This immediate feedback loop allows you to spot potential performance bottlenecks without needing to upload files or refresh a browser tab. You can instantly see the impact of:
- Large, unoptimized images.
- Render-blocking scripts in the
<head>. - CSS rules that cause unexpected layout shifts.
Testing Different HTML Structures for Optimal Performance
Experimentation is key to optimization. Use the dual-pane view to refine your code:
- Minify a section of your code and see if it breaks the layout in the preview.
- Beautify messy code from a third-party source to understand its structure.
- Move script tags from the head to the bottom of the body and watch the preview for rendering changes.
Our linked output tool ensures what you see is what you get, providing an accurate representation of how your code will behave.
Using URL Import to Analyze Competitor's Performance
- Enter a top-ranking competitor’s URL into HTML Viewer.
- Click Beautify to study their code structure and see how they organize their content.
- Minify their HTML to gauge how well-optimized their code already is.
- Identify optimization techniques they are using that you can adapt for your own site.
Advanced Techniques for Core Web Vitals
While HTML optimization is a cornerstone, achieving elite performance requires a holistic approach. Combine HTML Viewer's capabilities with these advanced strategies to push your Core Web Vitals scores into the green.
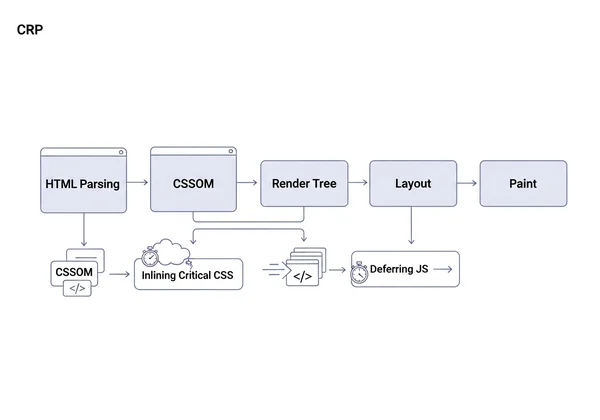
Prioritizing the Critical Rendering Path
The Critical Rendering Path refers to the sequence of steps a browser takes to convert HTML, CSS, and JavaScript into pixels on the screen. Delaying this process hurts your LCP.
-
Inline Critical CSS: Identify the CSS needed to render above-the-fold content and place it directly within a
<style>tag in the<head>of your HTML. -
Defer Non-Critical CSS: Load the rest of your stylesheet asynchronously. You can use HTML Viewer's editor to easily experiment with moving
<link>tags and addingdeferattributes.
Leveraging a Content Delivery Network (CDN)
A CDN stores copies of your assets (images, CSS, JS) on servers around the world. When a user visits your site, assets are delivered from the server closest to them, dramatically reducing latency and improving LCP. While HTML Viewer helps shrink your files, a CDN ensures they travel the shortest distance.
Combining Minification with Smart Asset Loading
After you've minified your code with our tool, consider how those assets are loaded.
- Use
asyncanddeferfor Scripts: Theasyncattribute downloads a script without blocking HTML parsing, whiledeferwaits until the HTML is fully parsed. Use the HTML editor to test which scripts can be safely deferred. - Lazy Load Images: For images below the fold, use the
loading="lazy"attribute. This tells the browser not to load the image until the user scrolls near it, improving initial LCP.
Start Optimizing Your Core Web Vitals Today with HTML Viewer
Core Web Vitals are no longer just a recommendation; they are a critical component of modern SEO and user experience. With HTML Viewer, you have a powerful toolkit at your fingertips that provides:
- Instant HTML analysis through direct paste or URL import.
- One-click optimization with powerful minify and beautify functions.
- Zero-lag previews to validate your performance tweaks in real-time.
Stop guessing what will improve your site's performance and start testing with precision. Optimize your site’s HTML now.
Core Web Vitals Optimization
What is a good Core Web Vitals score?
According to Google, "Good" scores are:
- LCP: 2.5 seconds or less
- FID: 100 milliseconds or less
- CLS: 0.1 or less
Use our tools to inspect and refine your code to help you reach these vital targets.
How often should I check my site’s Core Web Vitals?
It's best practice to check your scores monthly for established sites. You should also run a check immediately after any major design changes, code deployments, or before launching an SEO-critical campaign. Bookmark HTML Viewer for quick, on-demand audits.
Can HTML optimization alone fix all Core Web Vitals issues?
While optimizing your HTML is a huge step that directly impacts LCP and CLS, it's one part of a larger strategy. For the best results, combine it with image compression, leveraging a CDN for asset delivery, and implementing smart browser caching strategies.
How long does it take to see improvements in Core Web Vitals after optimization?
Once you deploy your changes, Google's crawlers will begin to notice them. It can take anywhere from a few days to a few weeks for the changes to be reflected in your Google Search Console Core Web Vitals report. However, you can see the immediate technical impact using tools like PageSpeed Insights.
Are Core Web Vitals more important than other ranking factors?
Core Web Vitals are a significant part of the "Page Experience" signals, which are among Google's many ranking factors. While high-quality, relevant content remains king, a poor user experience can undermine even the best content. Ignoring Core Web Vitals means leaving valuable ranking potential on the table.